
How To Use PageSpeed Insights For Website?
SERPView's PageSpeed Insights feature analyzes your website performance through a report that evaluates loading speed, Core Web Vitals, Accessibility, SEO, and technical improvement opportunities.
As website performance is important for determining UX, engagement, and search engine optimization, frequent checks help with better optimization. Moreover, slow-loading pages, delayed interactions, and unexpected, complex layouts often frustrate visitors and affect their interactions with a website.
SERPView lets you check the website's performance using PageSpeed Insights with a few clicks, as detailed here. We have also explained what each metric means for your website, so you can identify performance bottlenecks and fix them accordingly.
How To Check PageSpeed Insights For Your Website?
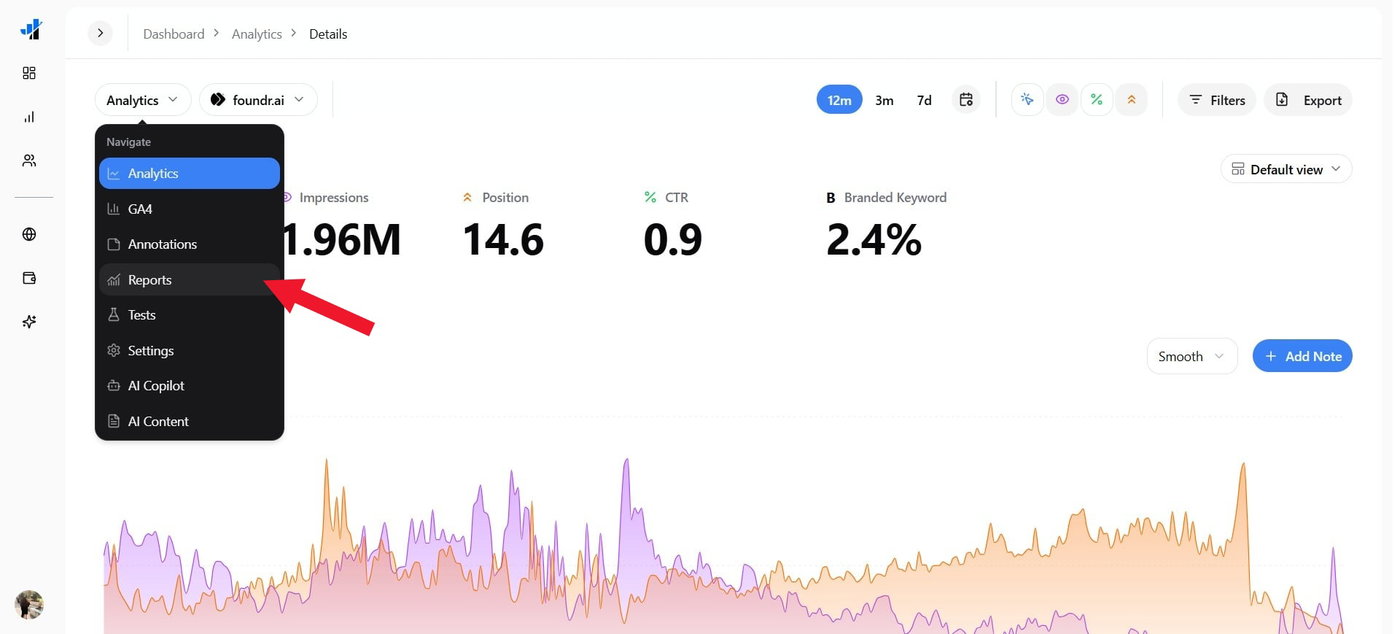
Go to the SERPView and open the property for which you want to view the report.
Click Analytics and select Reports.
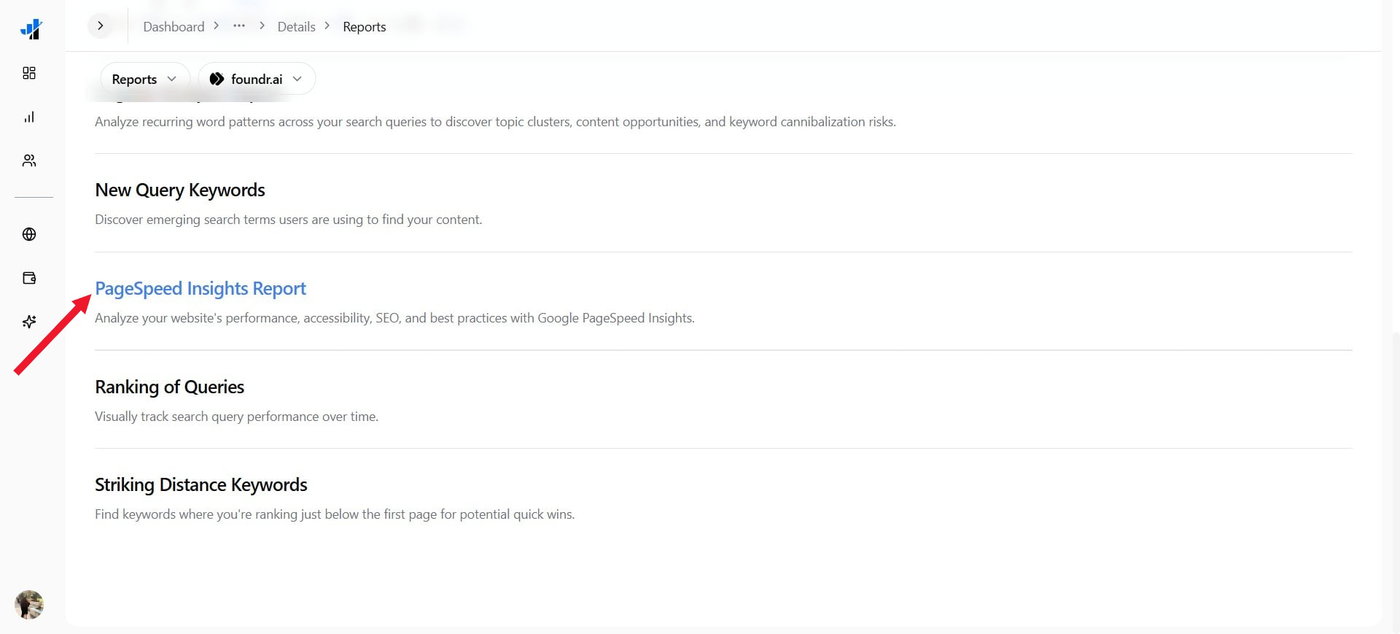
Scroll down and click PageSpeed Insights Report.
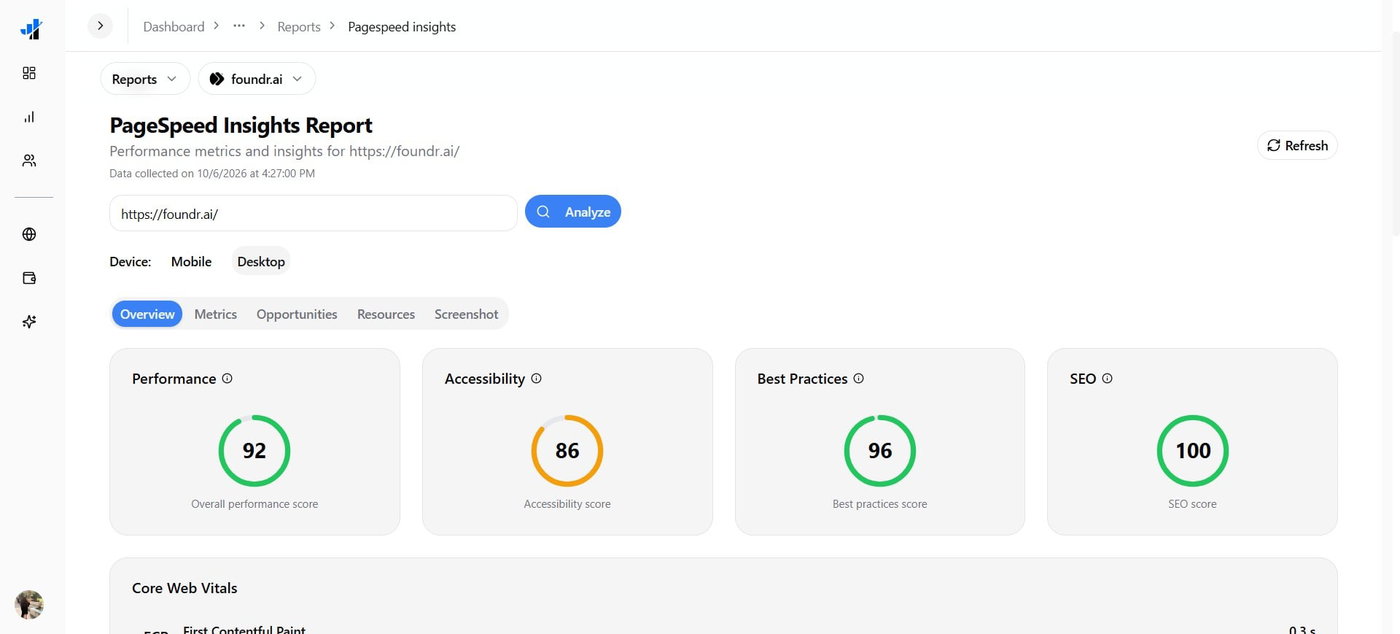
Now, it displays the overall scores for Performance, Accessibility, Best Practices, and SEO. It also shows Chrome Web Vitals, Improvement Opportunities, Additional Metrics, etc details.
Switch between tabs like Device, Metrics, Opportunities, Resources, and Screenshots based on what you want to check.
Moreover, at the top of the report, you can see an input box showing the webpage URL. You can change it to any other URL on your website to assess the performance of individual pages.
What Do The Overall Performance Scores Measure?
The Overview tab of the PageSpeed Insights report shows four main scores, which measure the following:
Performance Score: Measures how efficiently the webpage loads, renders content, and responds to user interactions. If the score is low, the loading time might be slow, JavaScript execution may be excessive, or resource delivery can be inefficient.
Accessibility Score: Checks if users with different abilities can access your webpage. It identifies issues such as insufficient color contrast, missing accessible names, and other barriers.
Best Practices Score: Evaluates whether the website complies with modern web development standards, such as security practices and technical recommendations, that contribute to a reliable browsing experience.
SEO Score: Analyzes whether the basic technical SEO requirements, such as crawlability and page metadata, are met. A higher score means that the page meets the tested SEO checks and standards, though it does not assure higher search rankings.
Together, these overall scores help to identify quick areas of improvement before checking detailed performance metrics.
How To Analyze FCP, LCP, TBT, and More?
Go to the Metrics tab and understand what is affecting your webpage performance. Each metric measures a different aspect of the user experience and helps you identify specific areas for optimization.
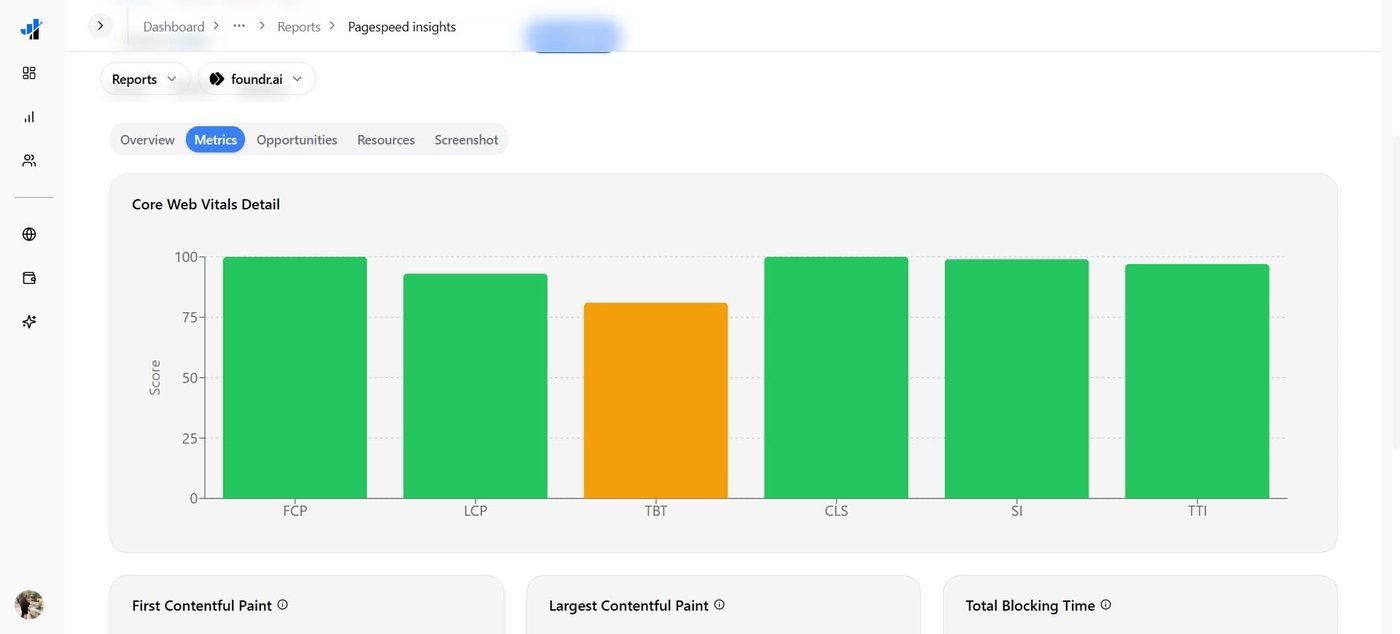
1] First Contentful Paint (FCP)
This measures the time required for the browser to display its first element, such as the first piece of content, text, image, or background element.
A faster FCP assures visitors that the webpage is loading and reduces loading uncertainty. So, optimize server response times, remove render-blocking resources, and prioritize critical content as needed.
2] Largest Contentful Paint (LCP)
LCP measures how long it takes for the largest visible content element in the crew port to load. This reveals when the main part of a webpage will be visible to visitors.
Compress and optimize large images, improve server response times, preload critical resources, and eliminate unnecessary delays in content rendering.
3] Total Blocking Time (TBT)
The TBT measures the total time during which long tasks block the browser's main thread, preventing it from responding actively to user interactions.
If it blocks excessively, the webpage would lag even though its content is visible.
Therefore, reduce JavaScript execution time, break long tasks into smaller segments, and defer non-essential scripts. Moreover, minimize unnecessary third-party code.
4] Cumulative Layout Shift (CLS)
CLS identifies the unexpected movement of visible elements when a webpage loads. This can hinder reading, lead to accidental clicks, and create other issues that create a frustrating user experience.
To fix it, specify image and video dimensions and avoid inserting content above existing elements. Do reserve space for dynamically loaded elements as the ideal practice.
5] Speed Index (SI)
The Speed Index measures how quickly visible content is popular when the page is loading. This provides insight into how quickly visitors perceive the page as visually complete.
For improving optimized critical rendering paths, reducing render-blocking resources, and prioritizing above-the-fold content.
6] Time to Interactive (TTI)
TTI measures how reliably long it takes for a webpage to become interactive. A page might appear visually complete but may not respond to user interactions consistently. Thus, checking matters; you can then reduce JS execution, minimize main-thread work, and defer non-critical resources.
Page Insights To Prioritize Improvement Opportunities
Switch to the Opportunities tab to see the issues affecting your webpage's performance and suggested improvements.
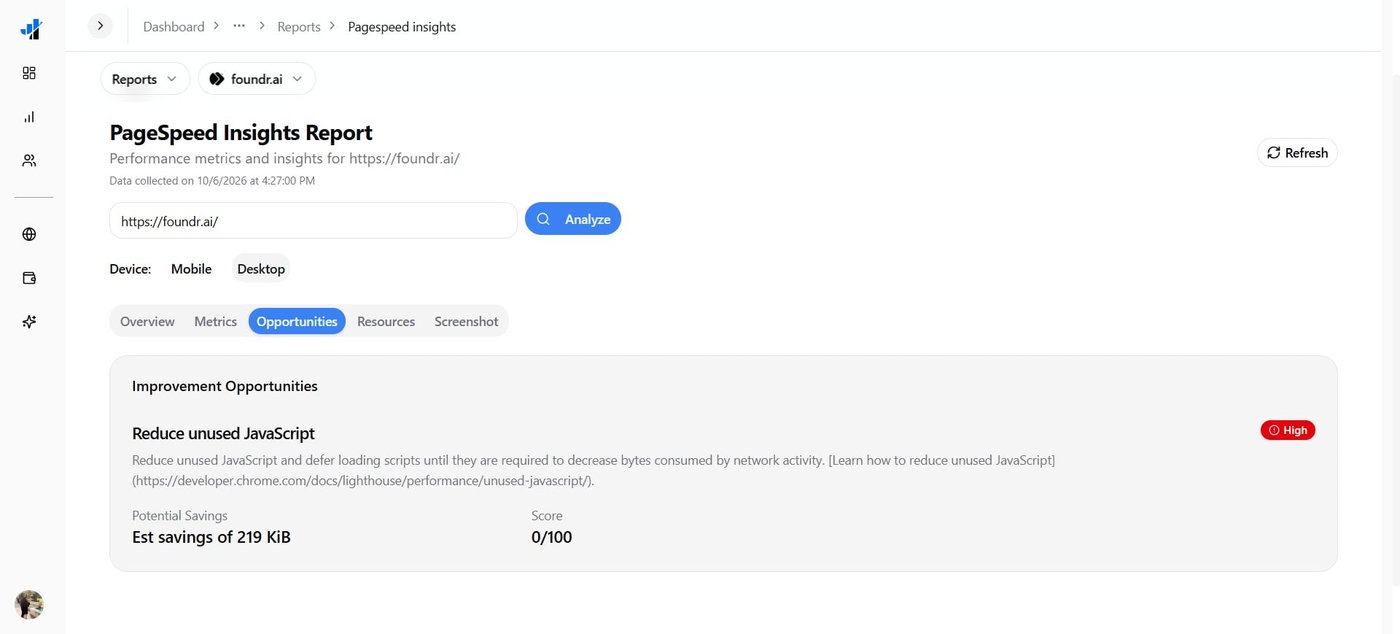
For instance, an opportunity for improvement to reduce unused JavaScript is the browser downloading code that is not needed for the current page experience.
Excessive unused JavaScript also increases network activity, consumes processing resources, and delays the delivery of important content.
What Are Potential Savings?
The Opportunities tab displays potential savings from reducing unused JS errors and estimates the amount of data or loading time that can be reduced by implementing the recommendation. For example, an opportunity with estimated savings of 254 KiB indicates that addressing the issue can reduce the amount of data transferred by that amount under the tested conditions.
Similarly, you would see other improvements that implementing the particular opportunity will result in.
Analyze the Resources Breakdown
The Resources tab helps to investigate the technical elements that contribute to your webpage's loading behavior. Some of them include JS files, CSS stylesheets, images, forms, and third-party scripts that affect the performance.
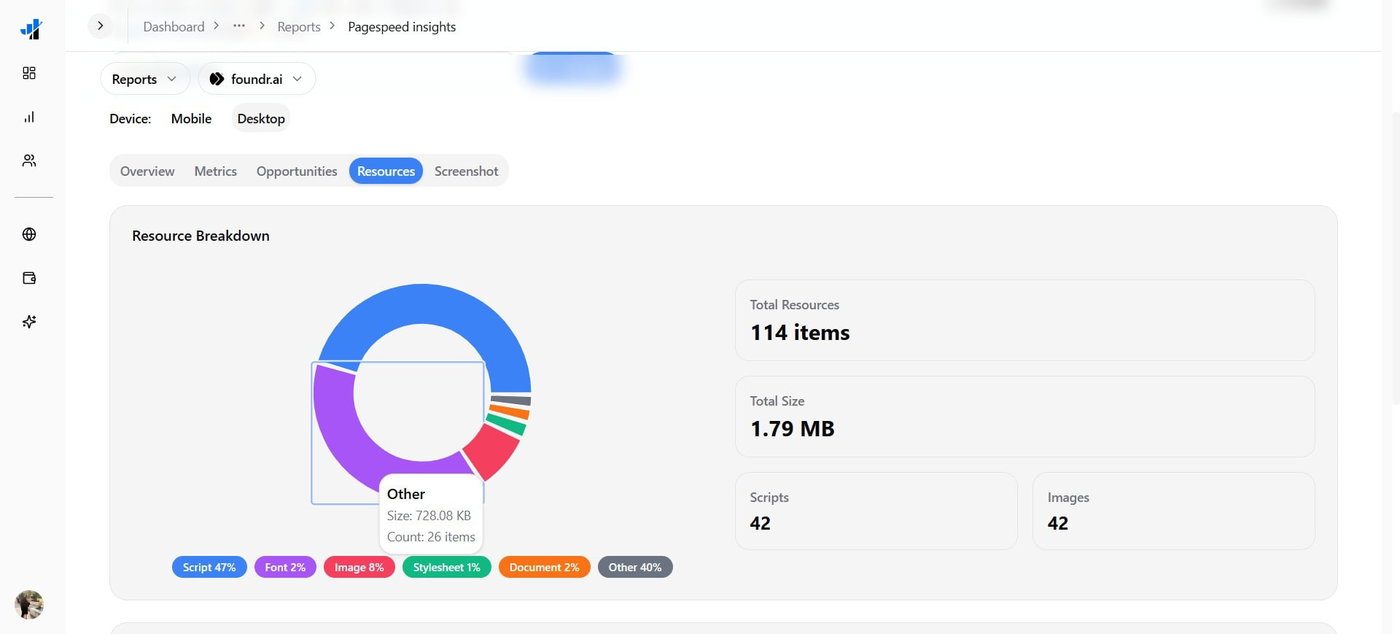
Studying them helps to:
Analyze unnecessarily large files
Know the scripts that consume a lot of processing time
Understand if third-party services are affecting loading time.
Check opportunities that reduce page weight.
Know which resources have to be optimized, deferred, or removed.
This is helpful if you depend on analytics platforms or related services for your website. By knowing if they or any other resources are affected, you can optimize them accordingly.
Inspect the Page Screenshot
The Screenshot tab displays a visual representation of the webpage. Use it alongside other metrics to understand content placement, optimization details, and requirements.
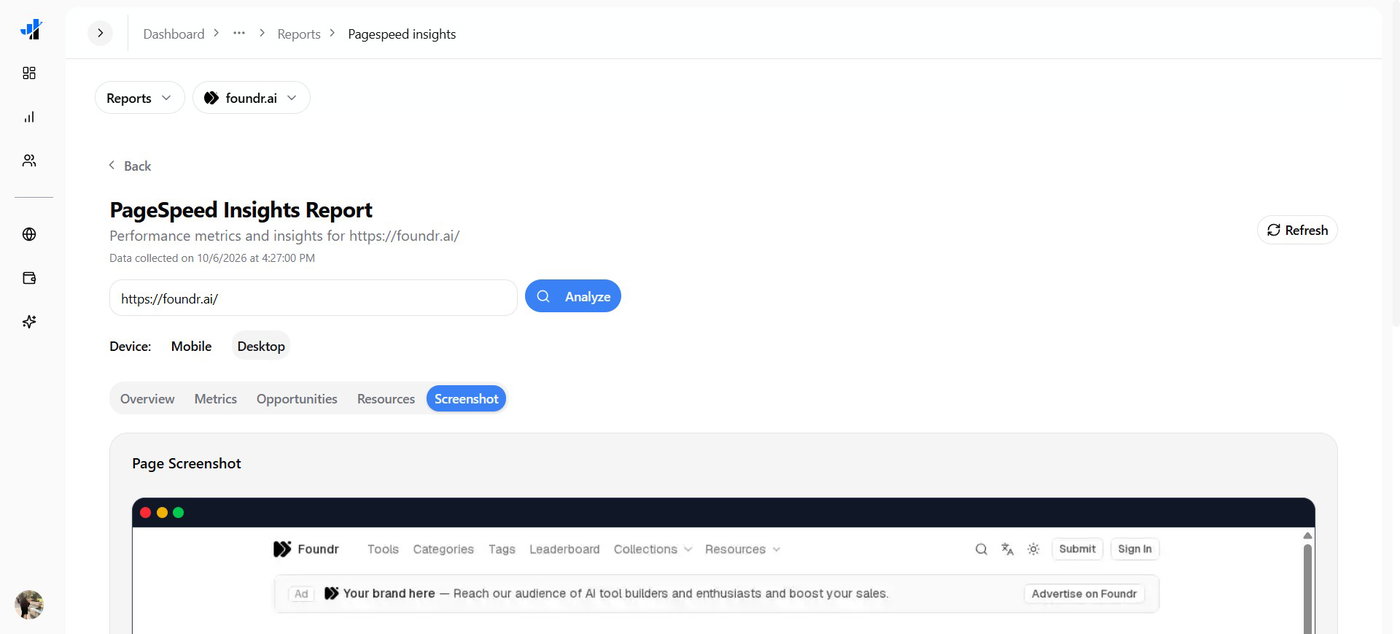
You can switch between the Mobile and Desktop tabs to see the performance for each. Accordingly, prioritize high-impact changes first, then the lower ones. Check every insight for performance bottlenecks, and not just the Overview.
After doing so, implement the changes, then re-audit using the Refresh button to see whether the scores have decreased.
So what's holding you back from identifying issues affecting your website performance? Use the SERPView PageSpeed Insights feature now for the most accurate results with detailed analysis!